

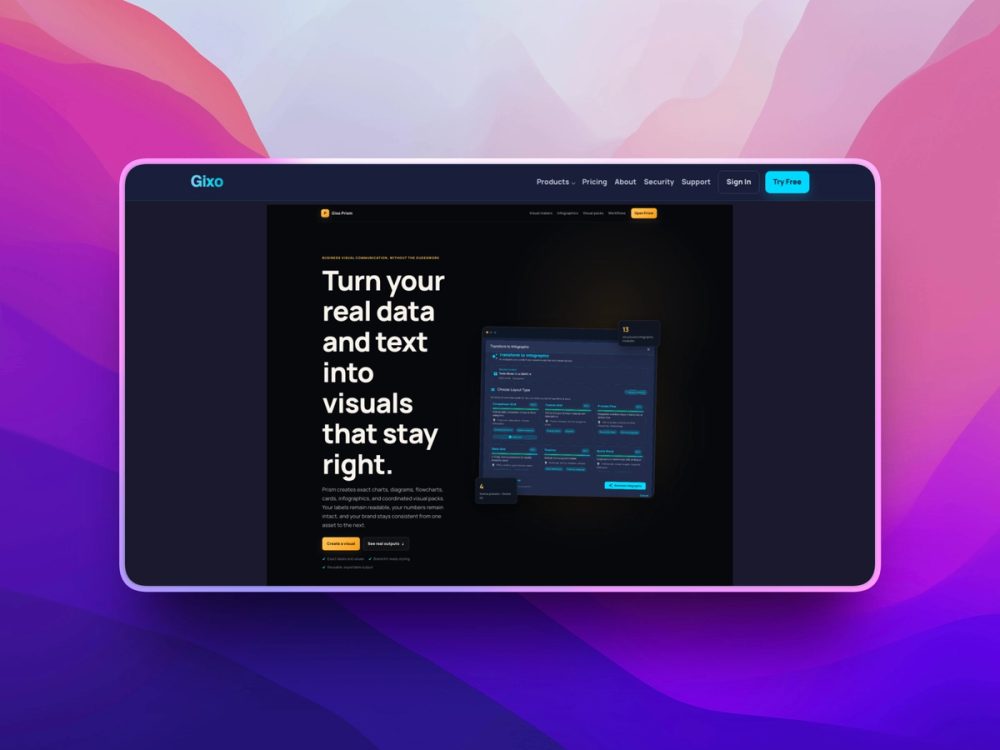
Gixo Prism is an AI-powered data visualization platform that transforms text, structured data, and source materials into professional charts, diagrams, flowcharts, infographics, and presentation-ready visuals. It preserves the accuracy of labels and values while generating reusable, brand-consistent visual assets for reports, presentations, marketing, and documentation.
Key Features
-
Deterministic Visual Layouts: Generate visuals with accurate text, labels, and data instead of pixel-based approximations.
-
Multiple Visualization Types: Create charts, diagrams, flowcharts, timelines, comparison cards, grids, statistics, and infographics.
-
Flexible Input Sources: Build visuals from plain text, structured datasets, existing documents, or drafts.
-
Visual Pack Generation: Produce coordinated collections of on-brand graphics for campaigns and projects.
-
Brand Kit Support: Apply brand colors, typography, and styling across every generated visual.
-
Multi-Format Export: Export visuals as HTML, SVG, PNG, PDF, and PPTX for easy reuse.
Use Cases
-
Business Reporting: Create charts and infographics for reports and executive summaries.
-
Marketing Content: Design branded visual assets for campaigns and presentations.
-
Documentation: Transform complex information into clear diagrams and process flows.
-
Data Visualization: Present structured data through readable charts and comparison layouts.
-
Presentation Design: Generate presentation-ready graphics for proposals, meetings, and slide decks.


